PROJECT REFERENCE
ProdSQL
Browser-based performance and health dashboard for centralised presentation of database and infrastructure metrics.
What problem does it solve?
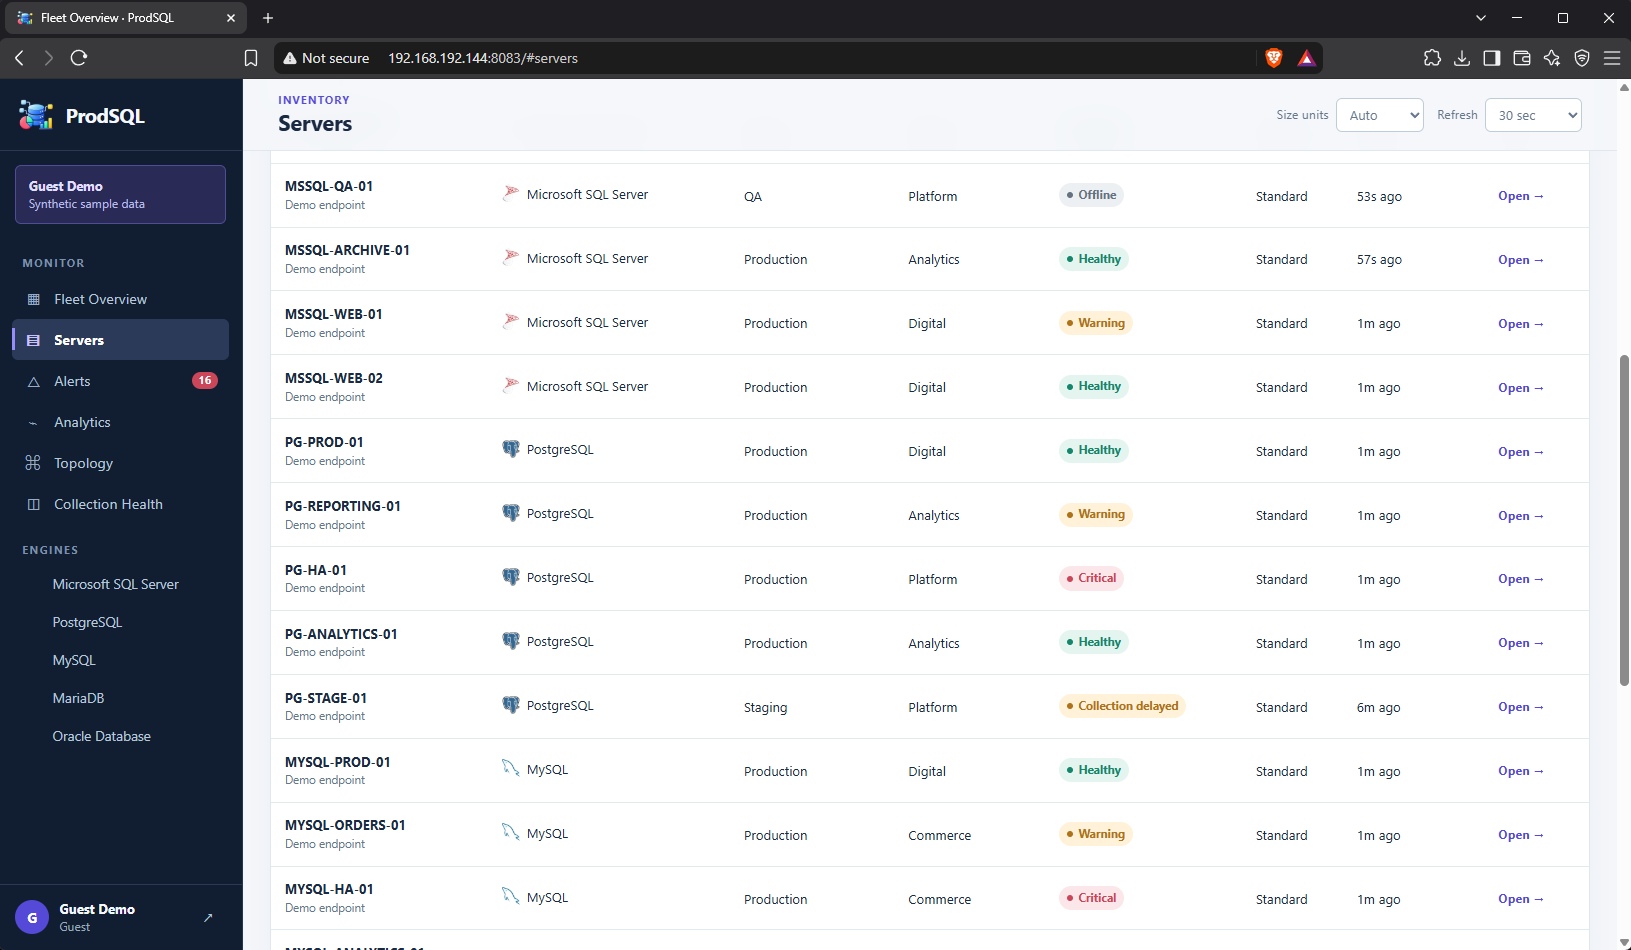
Database performance data is often distributed across system views, logs and separate administrative tools. The project gathers important operational and performance indicators into one web interface.
Key features
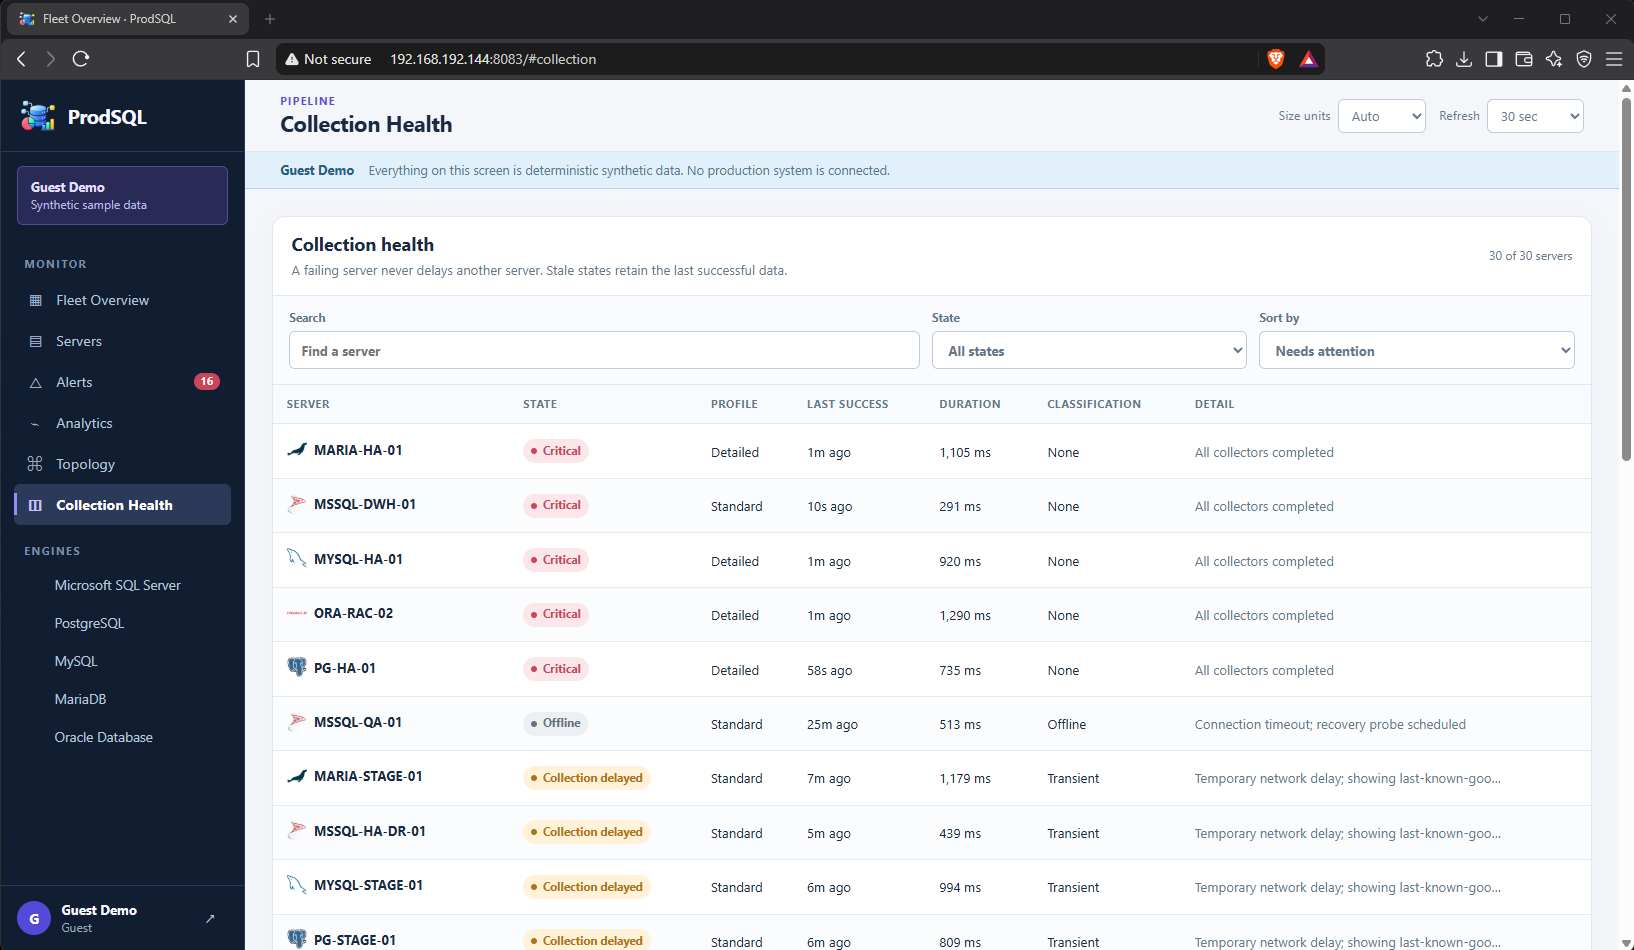
- Database and system health overview
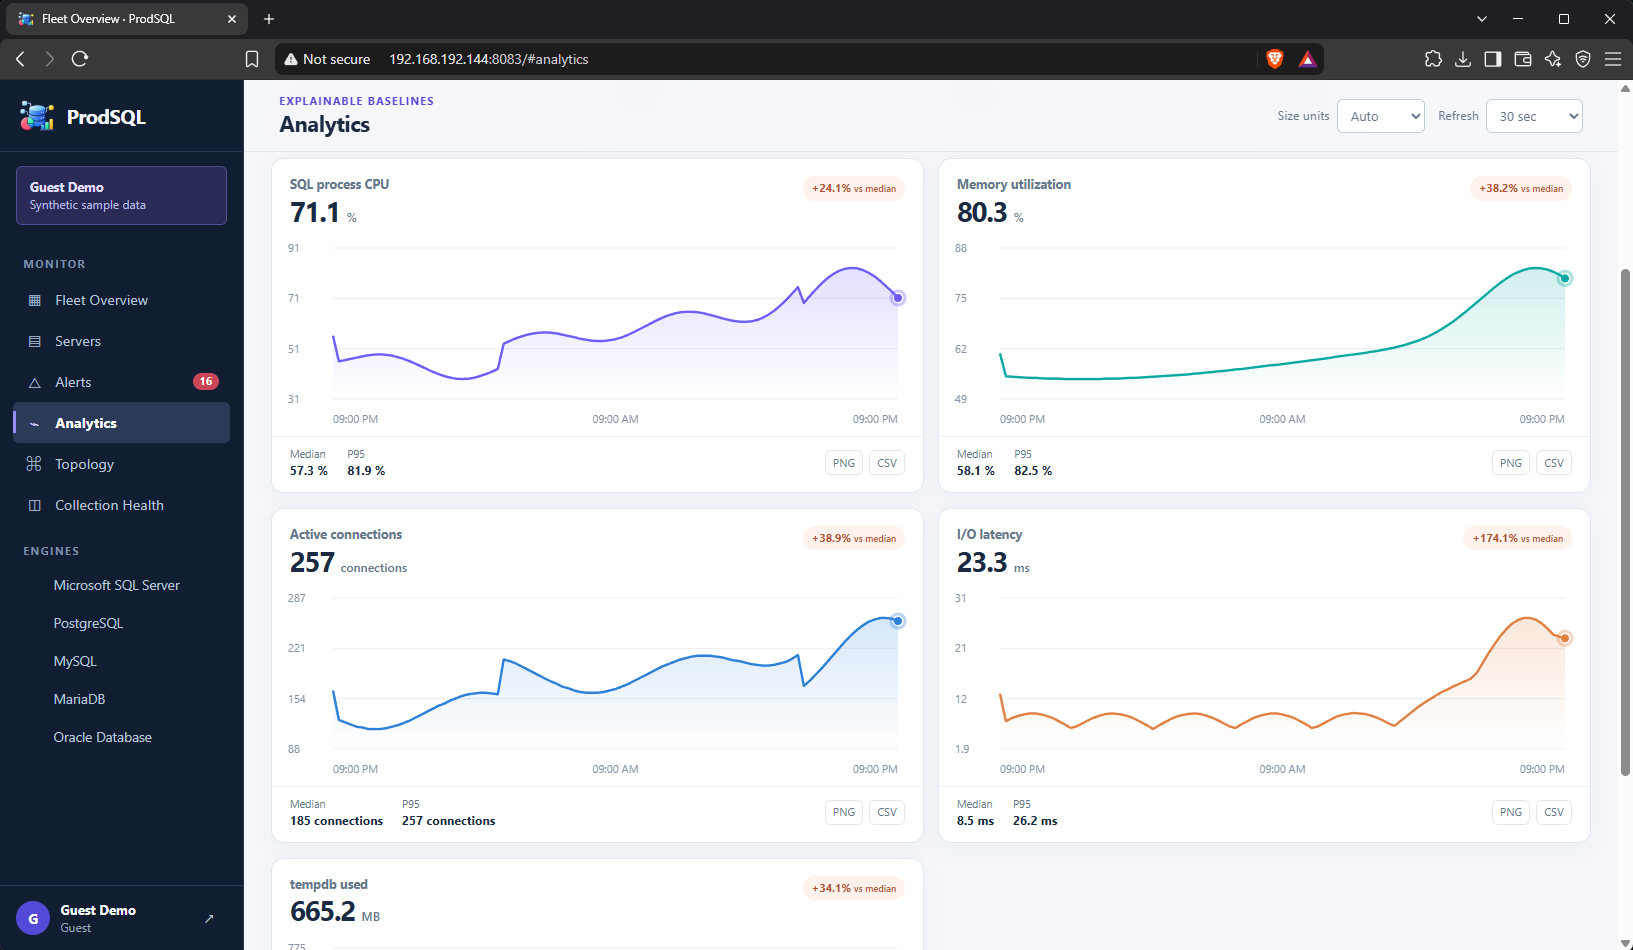
- Web-based performance metric presentation
- Current and time-series metrics
- Central dashboard with multiple categories
- Browser-accessible monitoring interface
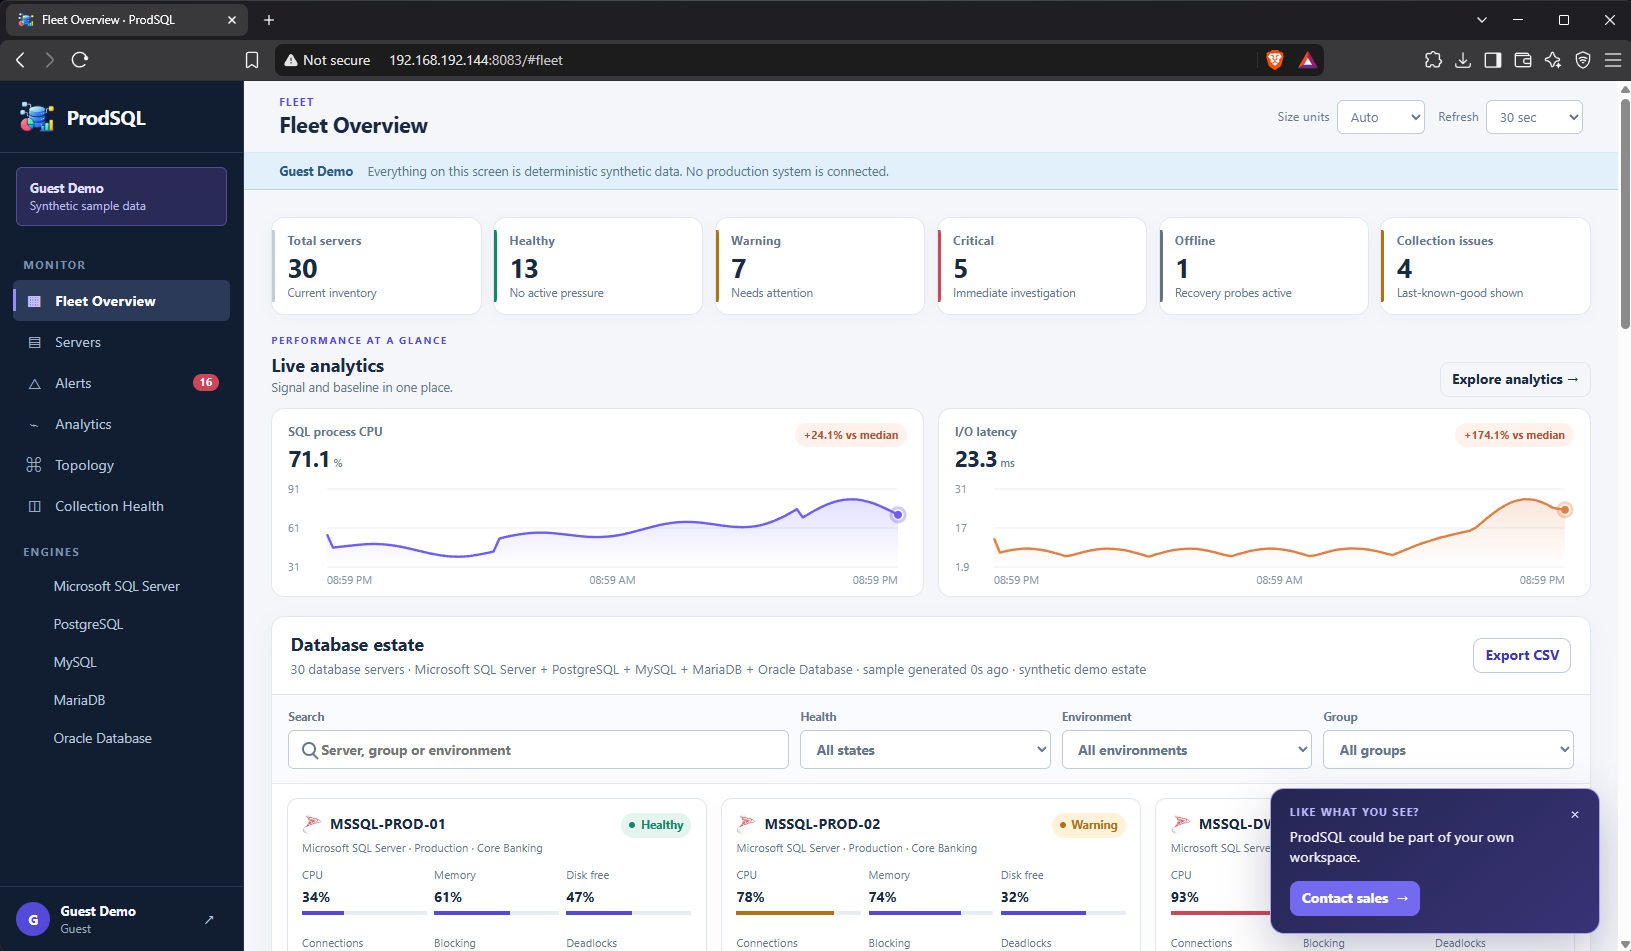
Click the image to view it in a larger size.
Technology stack
| Frontend | HTML, CSS, JavaScript / responsive web UI |
|---|---|
| Backend | ASP.NET Core / C# |
| Data access | Server-side queries and monitoring data collection |
| Presentation | Dashboard components and charts |
| Platform | Web application |
How it works
The backend collects or queries metrics from the monitored environment and exposes structured data to the web UI, where it is rendered as dashboard components and charts.
Engineering focus
The main challenge is separating monitoring logic from the presentation layer, refreshing data efficiently and keeping the dashboard responsive with larger datasets.
Screenshots